|
______________________________________________________
GLOBAL LIVESTOCK COLLABORATIVE RESEARCH PROJECT (GL-CRSP) ______________________________________________________ CRSP STUDY ON WILDLIFE, LIVESTOCK AND HUMAN INTERACTION IN KAJIADO DISRICT IN KENYA: RESULTS OF THE ECONOMIC STUDY
Draft Report
Prof. Stephen G. Mbogoh and Dr. Kimpei Munei of the
Dr. Philip Thornton of the
NAIROBI, OCTOBER, 1999 ______________________________________________________
GL-CRSP STUDY ON WILDLIFE, LIVESTOCK AND HUMAN INTERACTION IN KAJIADO DISTRICT IN KENYA: RESULTS OF THE ECONOMIC STUDY ------------------------------------------------------------------------------------------------------------ I: Introduction 1.1 The economic study of the wildlife, livestock and human interaction in Kajiado District of Kenya focused on the case of the Amboseli National Park wildlife dispersal areas encompassing the Kimana Group Ranch and the Mbirikani Group Ranch. The main objective of the study was to examine the economics of livestock keeping within the game reserves wildlife dispersal areas, including a documentation of the following: (ii) the magnitude of income and/or losses due to wildlife, ecotoursim and other non-livestock keeping activities in the said wildlife dispersal areas. II: Study Methodology 2.1 Both primary and secondary data collection methods were employed in this study. The activities involved in the study broadly included the following: (ii) design, testing, finalization and use of a simple survey instrument or questionnaire (see Annex I) to elicit information from the ranchers/pastoralists on the economics of group and commercial ranches in Kajiado District; (iii) field survey (data collection) using the survey instrument and through informal interviews; (iv) data processing and report writing.
2.2 Apart from informal discussions with relevant government officials and
other stakeholders in the Kimana and Mbirikani wildlife dispersal areas of the
Amboseli National Park, a sample of 34 members of the Kimana Group Ranch
and 27 members of the Mbirikani Group Ranch was randomly selected and interviewed
to establish the status of individual livestock ownership within the group
ranches and the associated costs and returns from the various economic
activities undertaken by these members. The two group ranches are representative
of the rest in terms of the mix of human economic activities carried on
as well as ecological conditions. However, we chose Kimana Group Ranch,
the smallest of the six group ranches, to reflect and represent the growing
importance of agro-pastoralism. Kimana Group Ranch has the highest proportion
of high potential land and consequently a high proportion of cultivated
area. Mbirikani Group Ranch, on the other hand, represents the other extreme
ecologically. Although containing some pockets of high potential land along
the rivers, Mbirikani Group Ranch basically consists of arid grassland.
Both group ranches, we believe, give a sufficient representation of the
nature of interaction between wildlife and livestock in the dispersal area
of the Amboseli National Park.
III: Study Findings 3.1 Background The focus of field work was on the Amboseli National Park wildlife dispersal
area. This covers the whole of Loitokitok Division, which is actually a
Sub-district, occupied by one Maasai section – the Ikisonko. There are
6 group ranches in the division which could have been sampled. The first
four are: Eselnkei, Mbirikani, Kimana and Ololarrashi group ranches, all
bordering Amboseli National Park. Two other group ranches, Kuku and Rombo,
border Tsavo National Park. All the six group ranches constitute the wildlife
dispersal areas of the two national parks and, therefore, contain one of
the highest concentrations of wildlife outside parks in East Africa. The
dispersal area is likely to have the greatest intensity of interaction
between wildlife and pastoral livestock. Table 1 gives the status of the
six group ranches in the wildlife dispersal areas for Amboseli National
Park.
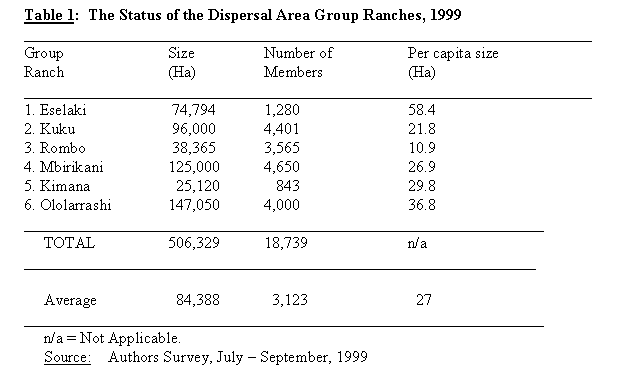
The six group ranches in the Amboseli Wildlife Dispersal Area, on average are the largest in size in the whole district, averaging 84,388 hectares. Their total area of 506,329 hectares is 31.8% of total group ranching area of the district. Average membership size is also high when compared to the whole district, being 3,123. Thus the average establishment in the event of subdivision may not be that different from the rest of the district. Even though the average per capita size entitlement is 27 hectares for all the six group ranches, it is as low as 10.9 hectares in one group ranch. Of the six group ranches, only one group ranch is currently undergoing subdivision, Ololarrashi/Olgulului Group Ranch, the largest group ranch in the whole district at 147,050 hectares and the one forming a ring enclosing the Amboseli National Park. 3.2 Land Tenure Reform and the Emergence of Wildlife/Livestock Conflict The land tenure reform programme implemented in Kajiado District from
1966 in which group and commercial ranches were established set the stage
for the development of conflict between wildlife and pastoral livestock.
Not that there were not any conflicts prior to establishment of ranches;
but the intensity of these conflicts was not such as to constrain coexistence.
Pastoralists were able to move about to avoid concentration of wildlife
in their grazing areas at certain seasons in order to minimize transmission
of diseases from the wildlife. But the assignment of property rights to
discrete land writs has circumscribed such movement and then reduced the
flexibility with which pastoralists could use nomadic movement to minimize
wildlife induced losses.
3.3 Status of Group Ranches in Kajiado District Kajiado District was the experimental district for the implementation of the government instigated group ranch programme: 52 group ranches were established in the district, covering 1,526,812 hectares which constitute about 76.4% of the previous trustland. The remaining 23.6% of the trustland involving some 472,000 hectares was adjudicated into 378 commercial ranches. This excludes land owned by the government or land meant for public utilities. The group ranch programme, therefore, covers the largest part of the land area in Kajiado District. The group ranch programme had the objective of increasing the offtake of pastoral livestock for commercial sale and thereby meeting the objective of satisfying the beef demand of urban markets and also commercializing livestock production for the benefit of the pastoralists. But probably more important is the objective of making the group ranch a vehicle for bringing development assistance to pastoralists in terms of communal facilities, such as boreholes, dams, and dips, which when shared by many pastoralists in a group ranch reduces unit cost to the individual due to economies of scale. Group ranches, in addition, allowed for communal grazing, just like traditional pastoralism, for the purposes of enabling pastoralists to make a smooth transition to commercial private ranching and to maintain mutually viable ranches (GOK, 1966 & 1969; IBRD, 1968]. However, the group ranch programme has not fared well. Hardly any of the objectives for which it was established has been attained (Munei, 1990 & 1991; IBRD, 1985; Meadows & White, 1981). This is because the group ranches do not operate as economic organizations, but merely as commercial land units with a shared title deed by many individuals who carry on their livestock production activities individually. The essence of the group ranch is the joint acquisition of ranch capital inputs like dips and boreholes. This would bring the pastoralists together in contributing to the establishment of these capital goods as well as in contributing to maintenance costs. But this aspect of group ranching is dormant. Most group ranches never managed to acquire these inputs and in those group ranches where they have acquired the inputs, many are rusting away from non-use. The individuals prefer to use hand pumps rather than communal dips, or to dig wells rather than jointly maintain and use a borehole. Without the sharing of acquired inputs, the group ranch remains merely
a joint ownership. The focus of individuals in group ranching then becomes
land ownership. Conflicts have arisen and proliferated over membership
of a group ranch and, therefore, over entitlement to a share of the group
ranch, as well as over the actual use of group ranch resources, such as
grazing and water. The group ranches that have not been subdivided are
mainly those that have pending court cases on dispute over land ownership.
There are also a few group ranches that have not been subdivided, either
because they are too dry (group ranches in Magadi division) or there are
some wildlife tourism benefits anticipated. Otherwise, the unmistakable
trend for group ranches in the district is a movement towards privatization
through subdivision. Table 2 gives the status of the subdivision of group
ranches by September, 1999.
Table 2 shows that 29 group ranches have been completely subdivided such that the owners have obtained individual title deeds. In total, these group ranches account for 50.9% of all group ranches, covering 552,734 hectares, which constitute 34.7% of group ranches area. However, when these are added to 11 other group ranches in the process of subdivision, the magnitude to group ranch privatization becomes quite significant. This makes the total of subdivided group ranches to be 40, constituting some 70% of all group ranches and 58.9% of group ranches moving into private ownership and control. Therefore, the only group ranches remaining intact are 17 in number, constituting 29.8% of all group ranches and covering 653,409 hectares, which is 41.2% of group ranching area.
A total of 269.6 hectares at Kimana are under irrigation by some 1,036 farmers in the private farms in addition to another 331.6 hectares at Namelok irrigation scheme on the part that is included in Kimana Group Ranch. Therefore, a substantial part of Kimana Group Ranch’s high potential land is devoted to cultivation. This is possible because Kimana is endowed with as many as 8 springs, thus ensuring a permanent supply of water for irrigation, livestock and domestic use. But also because KWS has provided an electric fence worth Kshs. 43 million that encloses the farms at Namelok irrigation scheme and Kimana’s holdings. The crops grown in the irrigation scheme are mainly horticultural crops, such as onions and tomatoes, and subsistence crops like maize and beans. These will be analysed in detail in a separate section. However, the means of livelihood for majority of group ranch members if livestock keeping. There are some 22,734 head of cattle in Kimana, including 200 dairy cattle, 1,634 crosses of Sahiwal and Boran and the rest are traditional Zebu cattle. Sheep number some 7,206 and goats number 12,533. Kimana Group Ranch has organized itself to establish some wildlife tourism enterprises. It receives income from several tented camps and a lodge within its premises. But probably more significant is that Kimana Group Ranch runs a wildlife sanctuary within the group ranch from which it receives income directly from tourists. The group ranch committee of Kimana is fairly active. It meets regularly and it documents income and expenditure from its wildlife tourism enterprises. This attempted transparency in the distribution of wildlife derived income has minimized conflict over leadership at Kimana Group Ranch. 3.4.2 Mbirikani Group Ranch Another sample of 27 pastoralists, some of whom also cultivate, was interviewed at Mbirikani Group Ranch. This group ranch is the second largest in the district after Ololarrashi/Olgurin Group Ranch, at 125,000 hectares. The group ranch is very arid and consequently the basic means of livelihood for most of its members is pastoralism. However, localized agriculture is carried out by a few individuals in river beds at Isinet and Namelok, as well as along the Noolturesh pipeline. The situation of wildlife and livestock interaction in the group ranch is strained. Pastoralists have been suffering heavy losses of livestock from wildlife. Some data collected between 1996 and 1998 show considerable damage imposed by wildlife on pastoral livestock (see Figures I, II, and III). In one year alone, over 100 head of cattle, and 300 sheep and goats were killed or maimed by wildlife. Unlike for Kimana Group Ranch, wildlife tourism benefits do not appear to sufficiently counterbalance these costs. Mbirikani Group Ranch also has a lodged paying rental fees and remitting conservation fees per tourist, as well as bird shooting fees to the group ranch. The distribution of this revenue between group ranch members appear not to be transparent and this has been a cause of considerable conflict in the group ranch. Currently, the group ranch is involved in a court case over leadership of the group ranch. 3.4.3 The Mbirikani Group Ranch is characterized by the following significant information: (ii) the ranch has a registered membership of 4,650 people; (iii) it has 2 dips, which charge Kshs. 5/= per head of cattle and Kshs. 2/= per sheep or goat to users; (iv) it has 2 boreholes developed at a capital cost of Kshs. 400,000/= each; users of the boreholes are charged Kshs. 4/= per head of cattle, but sheep and goats use the boreholes free of charge; (v) it has 1 well (at Noonkiyiaa) and 2 water tanks and troughs; the latter were developed at a capital cost of about 60,000/= each, and users are charged Kshs. 2.50 per head of cattle; (vi) it has 4 crush yards (at Noonkiyiaa, Oltiasika, Mbirikani and Chandi). (vii) in the recent past, the Mbirikani Group Ranch has spent:
The Kimana Group Ranch (often referred to as Kimana Tikondo) is characterized by the following significant information: (ii) the ranch has a registered membership of 843 people; (iii) it has 3 dips developed at a capital cost of Kshs. 300,000/= each; user charges are Kshs. 4/= per head of cattle and Kshs. 2/= per sheep or goat; (iv) it has 1 water tank and associated troughs, which was developed at a capital cost of Kshs. 100,000/=, with water covering piping over about 120 metres; (v) it has 3 crush yards which were developed at a capital cost of Kshs. 20,000/= each; (vi) it has 13 reserve pastures (11 Olopololi); (vii) it has about 2,529 hectares of land under irrigatiion; (viii) the development facilities provided to the ranch include:
3.5.1 A typical household in Mbirikani Group Ranch was found to have:
(ii) Of the household adults:
(iii) Of the children aged between 6 and 15 years:
(iv) Of the children aged below 6 years:
3.5.2 A typical household in the Kimana Group Ranch has:
(ii) Of the household adults:
(iii) Of the children aged between 6 and 15 years:
(iv) Of the children aged below 6 years:
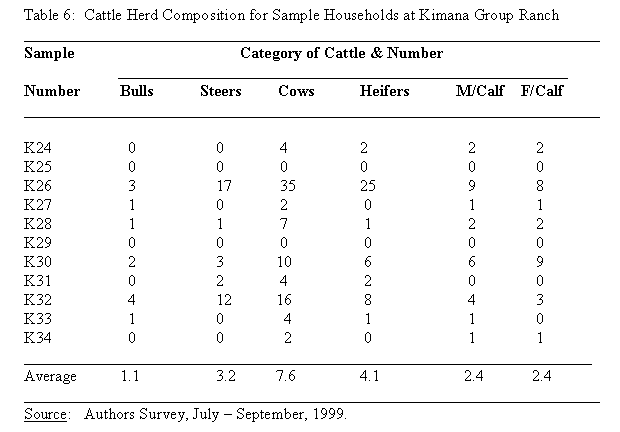
3.6 Herd Composition The average cattle herd composition per household at Mbirikani Group Ranch was as follows: (ii) 14.8 steers (iii) 28.4 cows (iv) 10.2 heifers (v) 7.9 male calves (vi) 11.5 female calves This gives an average of about 76.4 head of cattle per Mbirikani household..
(ii) 3.2 steers (iii) 7.6 cows (iv) 4.1 heifers (v) 2.4 male calves (vi) 2.4 female calves This gives an average of about 20.8 head of cattle per Kimana household.
3.6.4 When asked to state the objectives for keeping, selling or buying livestock, the pastoralists at Mbirikani Group Ranch gave the following answers:
(ii) Cattle were sold to meet household needs in all cases. (iii) Except in a few cases where some people bought cattle for trading purposes, the majority of cattle purchases were for breeding and herd build-up. 3.6.5 The objectives of keeping, selling and buying cattle at Kimana Group Ranch were not different from those at Mbirikani Group Ranch.
(ii) The objective of selling cattle was to get cash to meet household needs. (iii) The objective of purchasing cattle was for breeding and herd build-up in most cases, except where traders were found to be buying cattle for fattening before resale. 3.7 Livestock Ownership
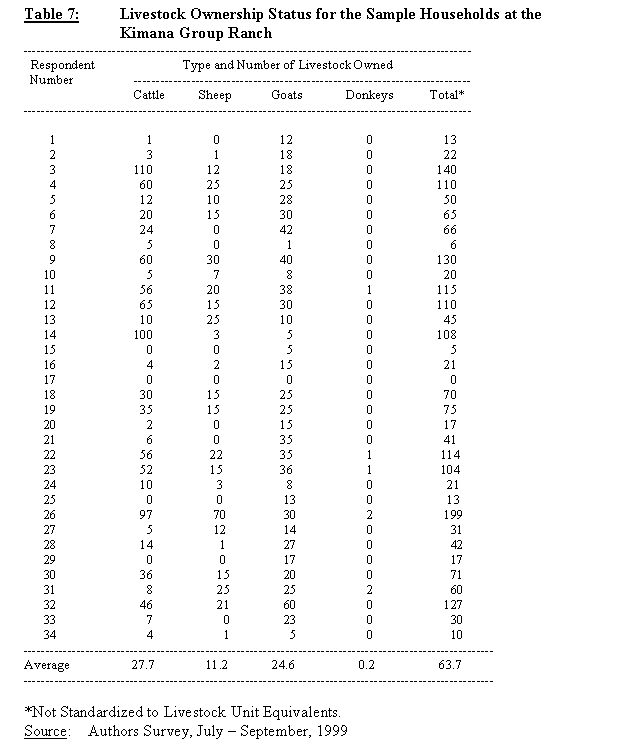
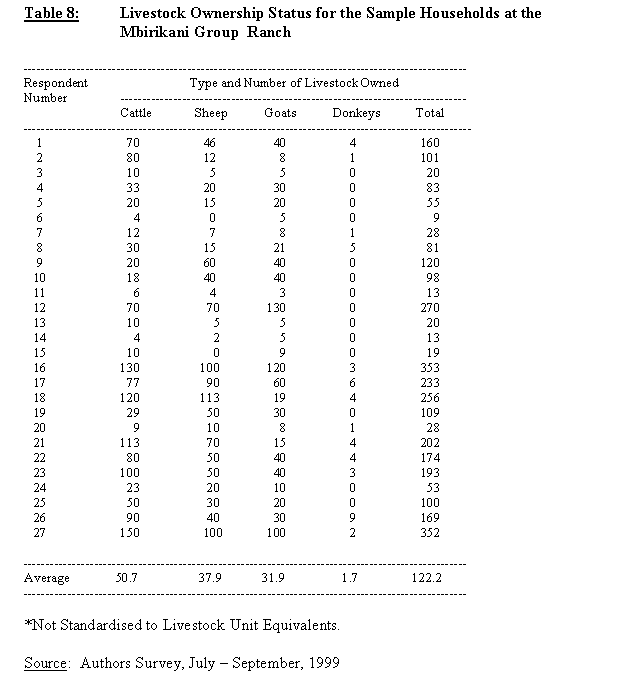
The results of the survey indicate that the average livestock ownership
in the case of large stock (cattle) is more or less the same in Kimana and Mbirikani
Group Ranches, but the ownership of small stock (sheep and goats) is different
in both ranches. On average, the pastoralists in Mbirikani Group Ranch
own more small stock (about 38 sheep and 32 goats per household) than their
counterparts in the Kimana Group Ranch (who own about 11 sheep and 25 goats
per household). Tables 7 and 8 indicate the livestock ownership situation
for the 34 and the 27 group ranch members interviewed in Kimana and Mbirikani
group ranches respectively.
Tables 7 and 8 show that the average herd ownership at Mbirikani Group
Ranch is higher than that at Kimana Group Ranch. This is partly because
Kimana is closer to the district headquarters and major urban areas (Kimana
and Oloitokitok) and partly because of the availability of more irrigable
land for crop production.
3.8 Costs of Livestock Production 3.8.1 The main sources of cost in livestock production in the Kimana and Mbirikani group ranches include: (ii) acaricide spray pump user charges or cost; (iii) acaricides; (iv) herding labour; (v) imputed cost of grazing and/or browsing on herbage/grasses; (vi) veterinary care: drugs and mineral supplements.
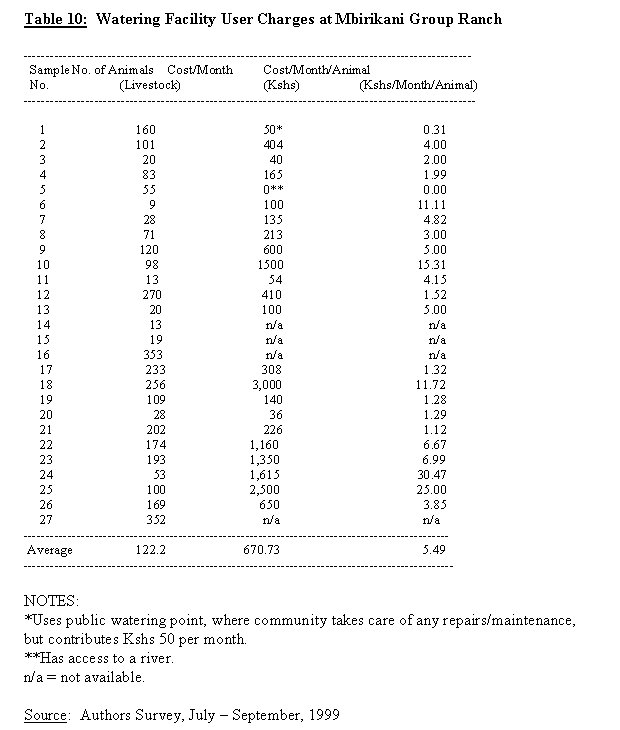
Assuming a useful life of 10 years for a spray pump, which implies a straight line depreciation rate of 10% per year, reasonable user cost of spray pump would be: (ii) Kshs. 44.30 per month per household at Mbirikani Group Ranch. (ii) 122.2 animals at Mbirikani; (ii) Kshs. 0.36 per head of livestock per month at Mbirikani. 3.8.4 Watering Facility User Charges:
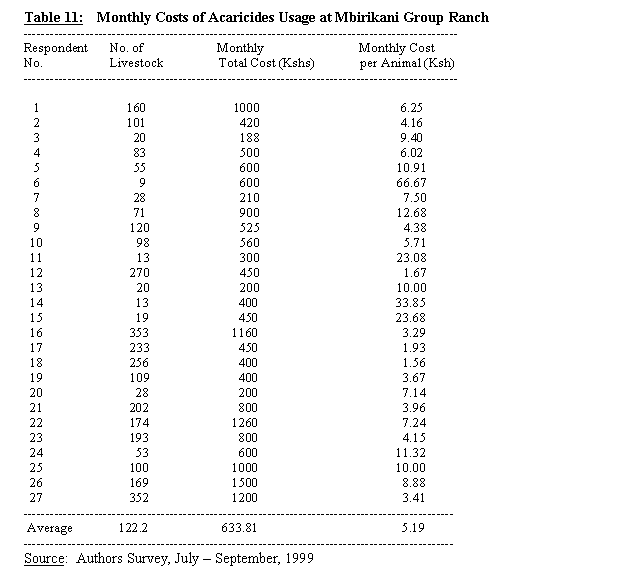
3.8.5 The cost of acaricide usage Tables 11 and 12 give a summary of the average monthly expenditures on acaricides per head of cattle per survey area. (ii) Kshs. 0 to Kshs. 40.00 per animal per month at Kimana Group Ranch, the overall average monthly acaricide expenditure per animal at Kimana being Kshs. 6.10 (see Table 12).
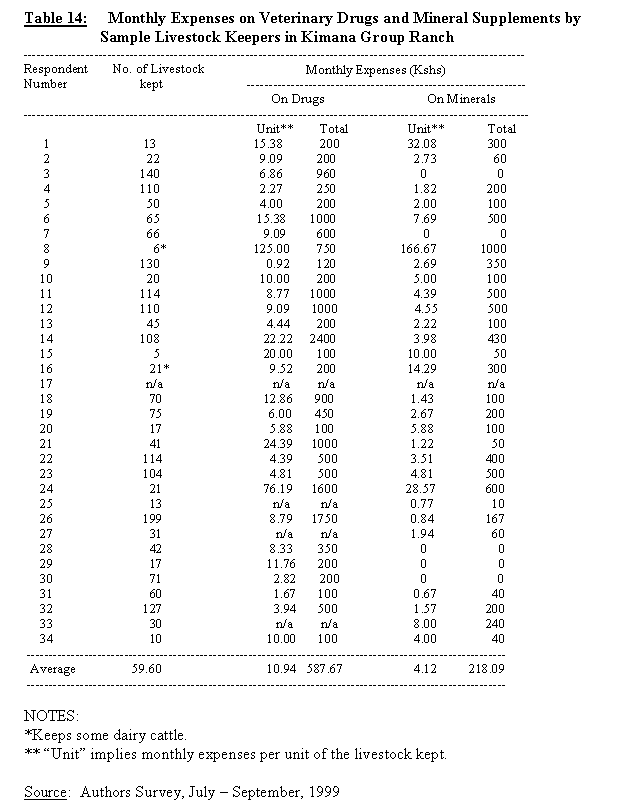
3.8.6. Veterinary Care Costs: Costs of Drugs and Mineral Supplements There is widespread use of veterinary drugs and mineral supplements in both Kimana and Mbirikani group ranches in livestock production. Tables 13 and 14 give a summary of monthly expenses on veterinary drugs and mineral supplements by the samples of livestock keepers in both ranches.
The survey results for the Mbirikani Group Ranch indicate a wide variation in the monthly costs of drugs and minerals per unit of the livestock kept. The range of monthly costs of drugs was from Kshs. 0.64 per animal to Kshs. 145.45 per animal, while the range of the monthly costs of minerals was from Kshs. 0 to Kshs. 55.56 per animal. The overall mean averages expenses were Kshs. 13.72 per animal per month on drugs and Kshs. 2.93 per animal per month on mineral supplements.
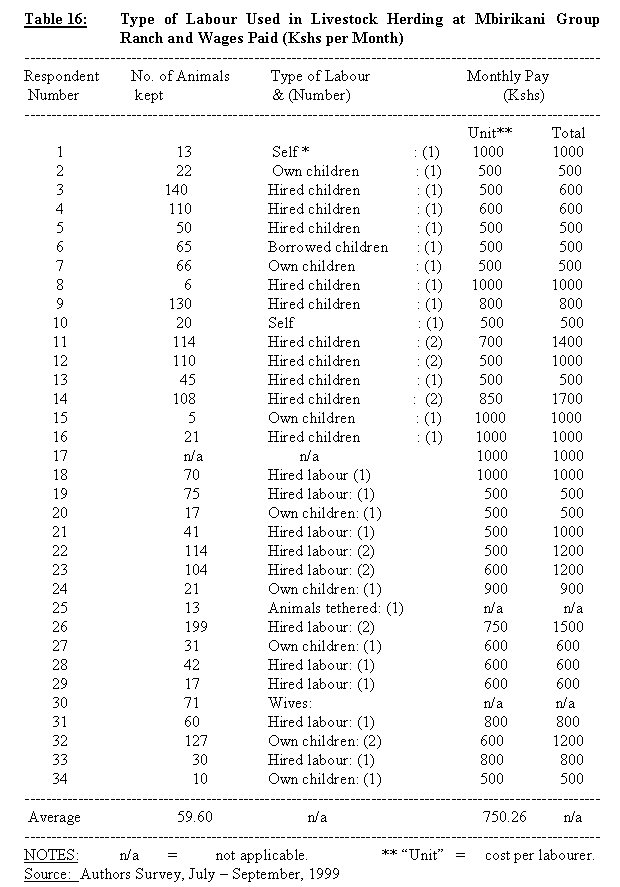
The survey results for Kimana Group Ranch, as in the case of the Mbirikani Group Ranch, exhibit a wide variation in the use of veterinary drugs and mineral supplements for animal health care from household to household within the group ranch. The average monthly expenses by households in Kimana Group Ranch on drugs and mineral supplements were as follows: (ii) from Kshs. 0.00 to Kshs. 166.67 per animal per month on mineral supplements. 3.8.7 Expenses on Herding Labour Children provided labour for livestock herding in both Kimana and Mbirikani group ranches. These could be "own children", or "hired children", and some cases of "borrowed children" were also reported. The range of wages/salaries paid for hired herding labour averaged from Kshs. 500 to Kshs. 1025 per labourer per month. Tables 15 and 16 illustrate the types of labourers used in livestock herding in Kimana and Mbirikani group ranches and the monthly wages/salaries paid by the sample households.
For evaluation purposes, the use of own labour in livestock herding (i.e "self" and "own" or "borrowed" children) is costed at the prevailing rates for hired labour. An evaluation of Tables 13 and 14 data suggests that livestock herding, on average, costs about: (ii) Kshs. 12.59 per animal per month at Kimana Group Ranch. As identified and documented in the proceeding paragraphs (see especially Tables 10 – 16), the major sources of costs in livestock production (mainly for meat) are: (ii) Dipping/spraying and acaricides (iii) Veterinary drugs & minerals (iv) Herding labour (v) Grazing/browsing charges/costs
The above unit monthly livestock production cost structure is based on the head of a "general livestock", and adjustments can be made when calculating the actual yearly cost of producing a specific type of livestock. For example, the average total unit cost of producing a unit of general livestock per month (i.e. Kshs. 83.40 and Kshs. 84.43 for Mbirikani and Kimana respectively) as calculated and presented in Table 17 could be inflated by up to 50% in the case of large stock (especially for cattle) production. For small stock (especially goats production), the general unit cost figure could be deflated by between 20 and 40 per cent. However, the average figures as presented in Table 17 appear to yield reasonable estimates of livestock production costs, and, from these data, we could conjecture the following: (ii) the total cost of producing a fully mature goat (local type), which may be expected to be ready for sale at about 18 months after being borne, would be about Kshs. (18 x 83.80) = Kshs. 1,508.40 at Mbirikani Group Ranch and Kshs. (18 x 84.43) = Kshs. 1,520.84 at Kimana Group Ranch. 3.9 Wildlife/Ecotourism 3.9.1 Individual members of the group ranches in the wildlife dispersal areas of the gazetted game reserves and national parks benefit in two major ways: (ii) from the income they share as group ranch members from the receipts and commissions from those who use any general tourist and ecotourist facilities located within their group ranches, including any statutory remittances by the Kenya Wildlife Services (KWS) based on the gate collections from the visitors to the game reserves and national parks for which the group ranches serve as wildlife dispersal areas. 3.9.2 This survey indicated the following to be possible indicators of the wildlife/ecotourist benefits to Kimana and Mbirikani Group Ranches in the recent past:
(b) Revenue from Wildlife-Tourism Enterprises: (1) Kimana Wildlife Sanctuary: 1998 Kshs. 182,120 + US$ 3,986 1997 Kshs. 584, 448 + US$ 5,021 1996 Kshs. 399,817 + US$ 6,816
(c)
Employment Opportunities:
(ii) For Mbirikani Group Ranch:
(b) Revenue from Wildlife-Tourism Enterprises:
(c) Employment Opportunities: 3.10.1 The major costs to group ranches include livestock losses due to: (ii) deaths of livestock due to attacks by the wildlife; (iii) maiming of livestock by the wildlife; (iv) human life losses/maiming of human beings following attacks by the wildlife.
(ii) the estimated numbers of livestock killed or maimed by wildlife in 1998 were as follows:
3.10.3 The Endoinyo Wuas Lodge, which is within the Mbirikani Group Ranch and is operated by Mr. Richard Bornham, has taken a special interest in the evaluation of human/wildlife conflicts within the Mbirikani Group Ranch. According to Mr. Richard Borhman’s records, 1997 appears to have been a difficult year, with the following number of livestock either killed or injured:
The 1998 records show that the following numbers of livestock were either killed or injured:
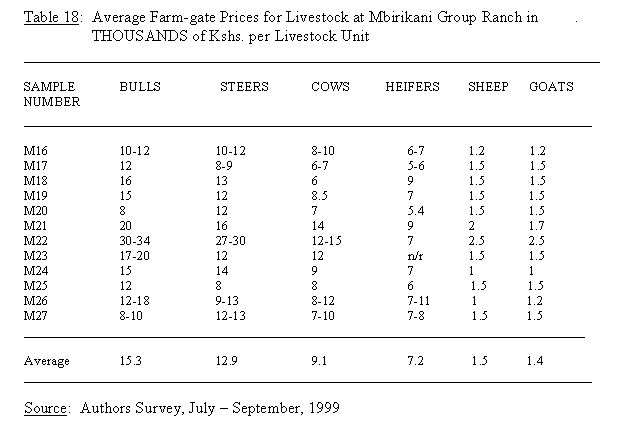
There were also reported cases of human injuries (mainly from snake bites and hyenas and lion attacks), crops destruction (mainly by elephants), and wildlife losses (mainly due to human activities). The records by Mr. Richard Bornham, therefore, agree with our findings at the Kimana Group Ranch that the small stock (sheep and goats) suffer most from wildlife attacks. Lions, leopards and hyenas are the major threats to livestock; elephants and other grazers are mainly a threat to crops where grown. 3.11 Off-Farm Income 3.11.1 At Mbirikani Group Ranch, 11 livestock keepers were asked if they get any off-farm income, and 45% claimed to get some, mainly from businesses and salaried employment. The average reported off-farm income was about Kshs. 2,020/= per month. 3.11.2 About 55% of the respondents at Kimana Group Ranch said that they do get off-farm income, once again from businesses and salaried employment. The average of the reported off-farm income was about Kshs. 4,492/= per month. 3.12 Milk Production and Utilization 3.12.1 Average milk production per household at Mbirikani Group Ranch was about 16.2 litres per day and ALL was basically consumed by the household. 3.12.2 At Kimana Group Ranch, the average milk production per household was 5.3 litres per day, and most was consumed by the household (only about 22% was sold). Kimana Group Ranch has Kimana town as an important commercial centre along the main Nairobi-Emali-Oloitokitok road, and only about 16 km from Oloitokitok, the Kajiado District headquarters. Hence there is a high degree of commercial activities among Kimana Group Ranch members. 3.13 Livestock Off-take Rates 3.13.1 At Mbirikani Group Ranch, the off-take rates are: (ii) 5.8 steers per household per year (representing 6.6% of the cattle herd). (iii) 4.8 cows per household per year (representing 5.4% of the cattle her). (iv) 0.9 heifers per household per year (representing 1.0% of the cattle herd). (v) Usually calves are not sold. (vi) 0.3 rams per household per year (representing 0.5% of the flock). (vii) 4.25 castrates of sheep per household per year (representing 6.5% of the sheep flock). (viii) 5.7% ewes per household per year (representing 8.7% of the sheep flock). (ix) Lambs (young sheep) are not sold. (x) 0.2 bucks per household per year (representing 0.4% of the goats flock). (xi) 4.6 castrates of goats per household per year (representing 0.3% of the goats flock). (xii) 5.5 does per household per year (representing 12.3% of the goats flock). (xiii) Kids are usually not sold. 3.13.2 At Kimana Group Ranch, the off-take rates are: (ii) 4.1 steers per household per year (representing 19.9% of the cattle herd). (iii) 3.4 cows per household per year (representing 16.5% of the cattle herd). (iv) 2.0 heifers per household per year (representing .7% of the cattle herd). (v) Usually no calves are sold. (vi) 1.6 rams per household per year (representing 11.9% of the sheepflock). (vii) 5.6 castrates of sheep per household per year (representing 41.5% of the sheep flock). (viii) 3.3 ewes per household per year (representing 24.4% of the sheep flock). (ix) Usually no lambs (young sheep) are sold. (x) 1.4 bucks per household per year (representing 6.4% of the goats flock) (xi) 6.4 castrates of goats per household per year (representing 12.3% of the goats flock). (xii) 2.7 does per household per year (representing 12.3% of the goats flock). (xiii) Usually no kids are sold. 3.13.3 The above data suggest the overall livestock off-take rates to be as follows: (ii) About 5.7% per year for sheep at Mbirikani Group Ranch. (iii) About 23.0% per year for goats at Mbirikani Group Ranch. (iv) About 77.8% per year for sheep at Kimana Group Ranch. (v) About 47.8% per year for goats at Kimana Group Ranch. 3.13.5 The reported average farm-gate prices for different types/categories of livestock were as given in Tables 18 and 19. All data reflect great variations within the year.
3.14 Livelihood from Crop Production 3.14.1 Significant crop production occurs within the Kimana Group Ranch, where irrigation is made possible by the streams flowing down from Mt. Kilimanjaro. Crop Production within the Mbirikani Group Ranch was not found to be significant. However, isolated pockets of crop production in Mbirikani Group Ranch occur wherever irrigation is possible. 3.14.2 Within the Kimana Group Ranch, the status of crop production is estimated be as follows: (ii) Number of Farmers = 337. (iii) Crops grown include mainly onions, tomatoes, kales (" sukuma wiki"), maize, beans and oranges.
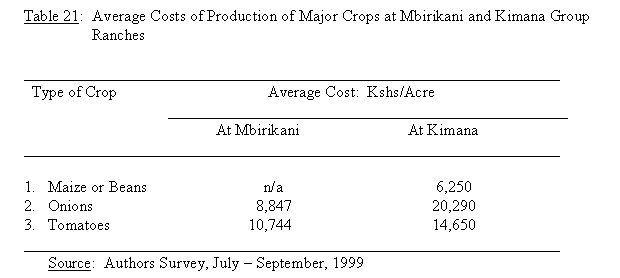
Horticultural production is mainly commercial oriented while maize and beans are produced mainly for subsistence. The study is still examining and intends to investigate further issues related to crop production costs, returns and price trends. These issues are to be documented in the near future. 3.14.4 The same crop enterprise combinations were found at Mbirikani Group Ranch. However, as noted earlier, crop production at Mbirikani is limited by lack of irrigation water. As a result, the yields realized at those areas where irrigated agriculture is practised at Mbirikani Group Ranch are generally lower than those realized at the Kimana Group Ranch. Owing to better management, the irrigated crop production at the Kimana Group Ranch can be said to be characterized by high input – high yields regime. The opposite is generally true for the situation at the Mbirikani Group Ranch. Kimana Group Ranch also enjoys very good (say excellent) market access for its produce. 3.14.5 The averages of the reported costs of crop production at Mbirikani and Kimana group ranches were as summarized in Table 21.
3.14.6 Reported crop producer prices are as summarized in Tables 22 and 23.
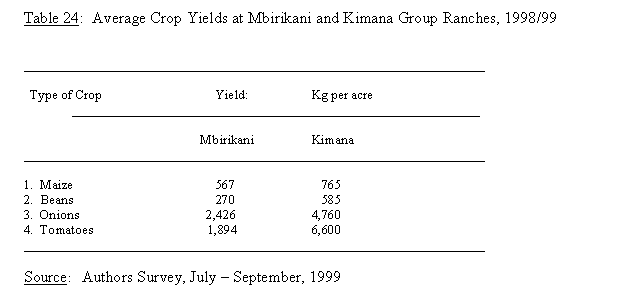
3.14.7 Based on the reported yields, the average realized outputs at Kimana and Mbirikani group ranches were found to be as summarized in Table 24.
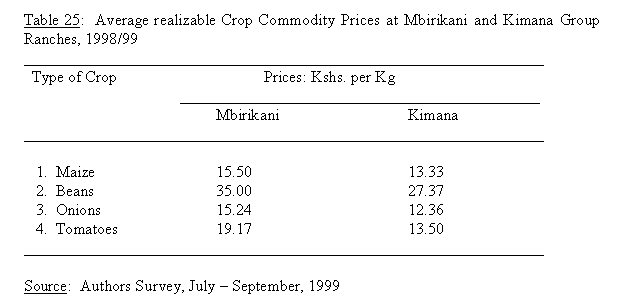
3.14.8 Based on a rapid market survey, the average realizable prices for the major crop commodities at Mbirikani and Kimana group ranches were found to be as summarized in Table 25.
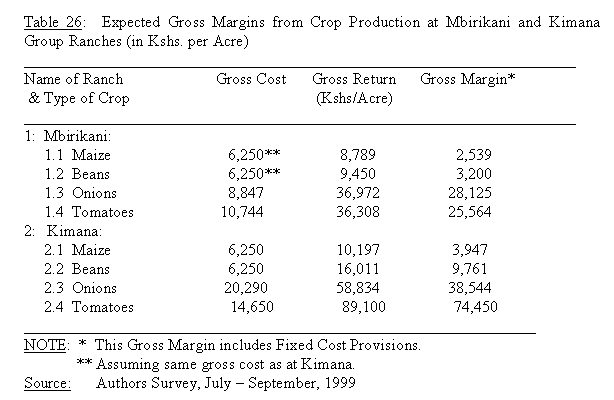
3.14.9 Given the average crop yields, production costs and realizable crop commodity prices, Table 26 summarizes the expected gross margins for the major crops produced at Mbirikani and Kimana group ranches.
The Table 26 data generally reflect highly attractive gross margins from crop production, which partly explains why most households strive to have an irrigated plot (1-2 acres) to produce crops both for food and income generation. The gross margins, as calculated, include returns to both fixed capital and land. Generally, they are over 50% of the gross variable costs, and they reflect very attractive rates of return to capital. 3.15 Concluding Remarks 3.15.1 There is no evidence of severe competition for available resources between livestock and crop production at both Mbirikani and Kimana group ranches. If anything, there appears to be some degree of supplementarity . Manure from cattle/livestock keeping finds use in crop production. Both enterprises give relatively high rates of return to capital, and most pastoralists and agro-pastoralists are able to derive their livelihood from the two enterprises. 3.15.2 The results presented and discussed in this report are based on a one-time, field survey involving single-visit interviews. Data used are mainly from memory recalls and were difficult to generate. There is need for more detailed case studies in the survey areas in order to be able to consclusively verify and estimate the economics of ranching and crop production within the livestock dispersal areas of the Amboseli National Park. IV Annexes |
