Your simulations can include the effects of documented changes in atmospheric CO2 and thus predict the effects on crop production. The direct effects of an increase in atmospheric CO2 concentration on soil processes will be insignificant because the CO2 concentration in the soil atmosphere is already greatly elevated. However, the indirect effects on SOM mediated through effects on plant processes could be substantial and must be accounted for in simulations of the effect of global change on SOM (Long, 1991). Net primary production, litter quality, and transpiration are all likely to be affected. Increases in atmospheric CO2 concentration have increased plant production of a wide variety of species by an average of 33% (Kimball, 1983). Generally, the plant dry matter response to increasing rates of CO2 can be approximated with a logarithmic response function (Gifford, 1979; Goudriaan, 1992):
where NPPE and NPP0 refer to net primary production in enriched and control CO2 environments respectively. Beta is an empirical parameter which ranges between 0 and approximately 0.7.
The response to CO2 is not simply due to the removal of a single limiting factor (Sinclair, 1992), but results from a hierarchy of effects (Acock, 1990).
Photosynthesis: Increasing CO2 has a direct effect on C availability by stimulating photosynthesis and reducing photorespiration. There is a very important difference between C3 species, such as wheat, and C4 species, such as corn, in this response. At CO2 concentrations around 350 umol/mol, C4 plants have higher rates of photosynthesis than C3 species. However, net photosynthesis in corn does not increase much beyond 400 umol/mol CO2, while wheat responds to CO2 levels up to 800 umol/mol (Akita and Moss, 1973). The growth response to CO2 is usually lower in C4 species than in C3 species (Wong, 1979; Rogers et al., 1983; Morrison and Gifford, 1984b; Cure and Acock, 1986). With wheat, a growth response to elevated CO2 is almost invariably obtained (Kimball, 1983; Cure and Acock, 1986). Corn sometimes shows no response to CO2 (Hocking and Meyer, 1991b). In a field study with elevated CO2 in open top chambers, in which corn growth was increased by about 40%, there was no effect on net photosynthesis per unit leaf area (Rogers et al., 1983). Summarizing a number of experiments, Cure and Acock (1986) found average biomass responses of 31, 9, and 9% for wheat, corn and sorghum respectively. The main reason for responses to CO2 in C4 species is due to improved water use efficiency as discussed below.
Stomatal conductance: Increased CO2 concentrations will decrease stomatal conductance (Moss et al., 1961; Akita and Moss, 1973; Wong, 1979; Rogers et al., 1983; Morrison and Gifford, 1984a) at high CO2 concentrations, which reduces the transpiration rate per unit leaf area. Reduced transpiration will also increase the leaf temperature which can further increase photosynthesis (Acock, 1990). The effect on stomatal conductance and transpiration is observed in both C3 and C4 species. Over a range of species Morrison and Gifford (1984a) found that stomatal conductance was reduced by 36% while transpiration was reduced by 21%, the difference being attributed to the higher leaf temperatures. Similar average values of 34% and 23% for stomatal conductance and transpiration respectively were found in the literature survey of Cure and Acock (1986). Both an increase in photosynthesis and a decrease in transpiration result in an increase in the plant's water use efficiency.
N concentration: Increased CO2 decreases plant N concentration in C3 species (Schmitt and Edwards, 1981; Hocking and Meyer, 1991b). Clearly with a fixed nutrient supply, an increase in C assimilation is likely to result in lower plant nutrient concentrations due to a dilution effect, but this is not the only effect. Hocking and Meyer (1991a) clearly demonstrated that the critical plant N concentration for 90% maximum yield is decreased under elevated CO2. However, CO2 had little effect on the relationship between relative yield and the external N concentration. A practical implication of this is that similar fertilizer application rates will still allow near maximum yields under a high CO2 environment, but that more fertilizer may be required to maintain similar grain protein concentrations (Hocking and Meyer, 1991b). Physiologically, an increase in N use efficiency in C3 species with elevated CO2 has been related to decreased concentrations of the enzyme ribulose 1,5-bisphosphate carboxylase (Schmitt and Edwards, 1981) which catalyses the initial carboxylation reaction in C3 species and accounts for a large proportion of the leaf protein.
Root growth:
Increased CO2 increases root growth.
This also affects plant growth and SOM amounts.
Most studies with elevated CO2 with grain crops in which
root growth has been measured show very little or no effect on
the root to shoot ratio (Cure and Acock, 1986). The above effects
can be taken into account in CENTURY model simulations of global
change effects by selecting the enriched CO2 option in
EVENT100. This option can be implemented with either a constant
CO2 concentration or with a linear ramp with annual
increments from an initial concentration to a final
concentration; the parameters CO2RMP, CO2PPM(1), and CO2PPM(2)
are found in the fix.100 file. The various effects of
CO2 described above are controlled by functions of the
CO2 concentration and crop or tree specific parameters
in crop.100 and tree.100. Parameter
values are set using reference concentrations of 350 and 700 ppm
CO2 for ambient and doubled CO2
respectively.
The impact on maximum potential monthly production is
described by a transformation of Equation 3 given above in order
that the relative production for doubled CO2 can be
set for each crop (CO2IPR(*), crop.100,
tree.100). The effect on potential transpiration
rate also uses this equation with the fraction to which the
transpiration will be reduced with a doubling of atmospheric
CO2 set (CO2ITR(*), crop.100,
tree.100). The effect of elevated CO2 on
carbon to element ratios is similarly modelled with the effect of
doubled CO2 on the minimum and maximum ratios for N,
P, and S, in the shoots of grasses and crops and in the leaves of
trees set (CO2ICE(*,*,*), crop.100,
tree.100). The effect of CO2 on the
allocation of C to roots is set by (CO2IRS(*),
crop.100, tree.100) which specifies the
proportional increase in the root to shoot ratio at doubled
CO2. A linear relationship of this effect with
CO2 concentration is assumed.
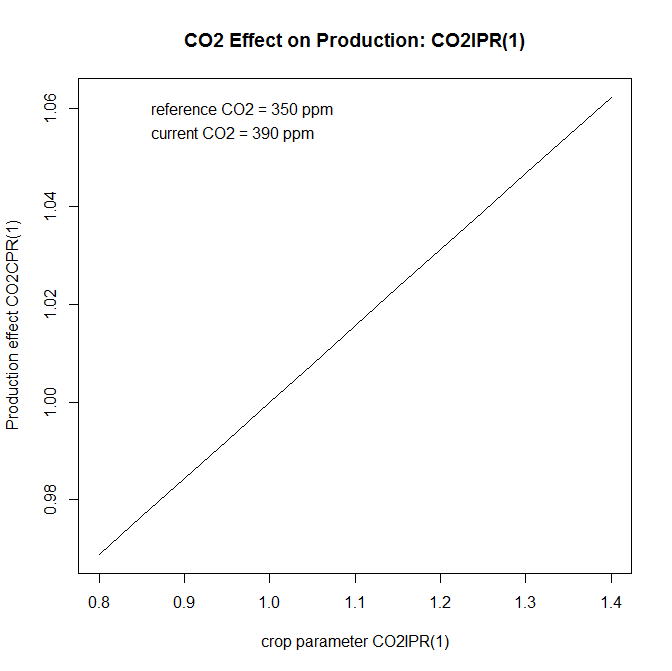
The relationship between CO2IPR(*) and the fractional change in production is below.
Turn on the CO2 effect by setting the CO2 Systems to 1 in the simulation configuration section of the schedule file. Then specify the start and end years in which the CO2 effects will be applied. The following example shows an example schedule file header:
1950          Starting year
2000          Last year
NotUsed       Site file name
0             Labeling type
-1            Labeling year
-1            Microcosm
1 1950 2000   CO2 Systems
1             Initial system
TMC3          Initial crop
TMCF          Initial tree
Rather than calculate the CO2 using the algorithm described above, you can provide a file of atmospheric CO2 concentration values (ppm) per year.
The file of the CO2 file is in text format, and contains records of "year concentration" values. The organization is:
comment lines beginning with # or ! (optional)
year-1 (space or tab) concentration
...
year-N (space or tab) concentration
where year is the simulation year, and concentration is the CO2 concentration for that year in ppm. For example:
2000    368.865
2001    370.467
2002    372.522
2003    374.76
2004    376.812
2005    378.812
Specify the CO2 concentration data file by setting the CO2 Systems to 2 in the simulation configuration section of the schedule file. Then specify the start and end years in which the CO2 effects will be applied. On the following line, provide the CO2 data file name. The following example shows an example schedule file header:
1950          Starting year
2000          Last year
NotUsed       Site file name
0             Labeling type
-1            Labeling year
-1            Microcosm
2 1950 2000   CO2 Systems
CO2_20thCentury.txt
1             Initial system
TMC3          Initial crop
TMCF          Initial tree
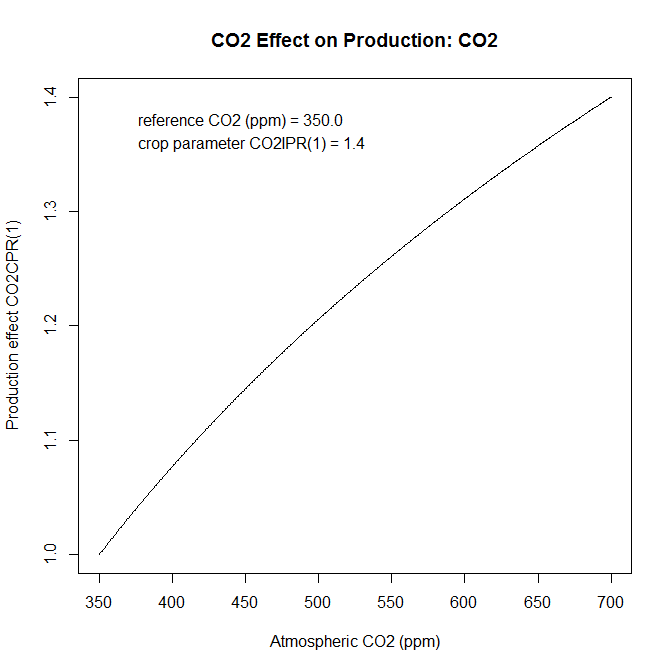
The relationship between CO2 (ppm) and the fractional change in production is below.