Crop and Grassland Submodel
The model can simulate a wide variety of crops and grasslands by altering a number
of crop-specific parameters (see the crop parameters).
CENTURY is not specifically designed to be a plant production model and some
parameters may have to be calibrated for specific environments.
The plant production model (Figure 3-7)
has pools for live shoots and roots, and standing dead plant material. Potential
production (g C m-2 month-1) is a function of a genetic
maximum defined for each crop
(crop parameter PRDX(1))
and scalars with values ranging from 0-1, reflecting the effects of soil temperature,
soil water content, canopy shading, root production, nutrient availability, harvesting,
death of plant parts, fire, and grazing. These effects are described below,
except for grazing, which is described in the section "Grazing".
Temperature Effect upon Production
The maximum potential production of a crop, unlimited by temperature, moisture
or nutrient stresses, is primarily determined by the level of photosynthetically
active radiation, the maximum net assimilation rate of photosynthesis, the
efficiency of conversion of carbohydrate into plant constituents, and the maintenance
respiration rate
(van Heemst, 1986).
Thus, the parameter for maximum potential production
(PRDX(1))
has both genetic and environmental components. However, in CENTURY, the seasonal
distribution of production is primarily controlled by the temperature response
function rather than the seasonal variation in photosynthetically active radiation,
so the maximum potential production parameter should reflect aboveground crop
production in optimal summer conditions. This parameter will frequently be used
to calibrate the predicted crop production for different environments, species,
and varieties. In the CENTURY model formulation the potential production is based
on aboveground production, therefore root-shoot allocation must also be taken
into account. The value used should be set according to estimates of potential
crop production. In general, C4 species have higher potential growth rates than
C3 species because of higher maximum net assimilation rates
(van Heemst, 1986).
The range of potential production from less than 200 to 580 kg DM / ha / day
corresponds to 150 to 700 g C / m2 / month.
The growth of most plant species exhibits a response curve to root temperature
which is sigmoidal up to an optimum temperature, has a band of optimum temperatures
over which there is relatively little effect on growth, and a rapid decline
above the optimum
(Cooper, 1973).
Plant growth rates will depend on the combined temperature response of photosynthesis
and respiration. For most temperate species the lower limit at which the rate
of development is perceptible is between zero and 5 C. Development increases
in rate up to an optimum of 20 to 25 C and then declines to an upper limiting
temperature between 30 and 35 C. For tropical species the base, optimum and maximum
temperatures are approximately 10 higher
(Monteith, 1981).
In the CENTURY model the temperature response curve can be parameterized for
each crop using a generalized Poisson density function
(PPDF(1...4))
as shown in Figure 3-8a
and 3-8b.
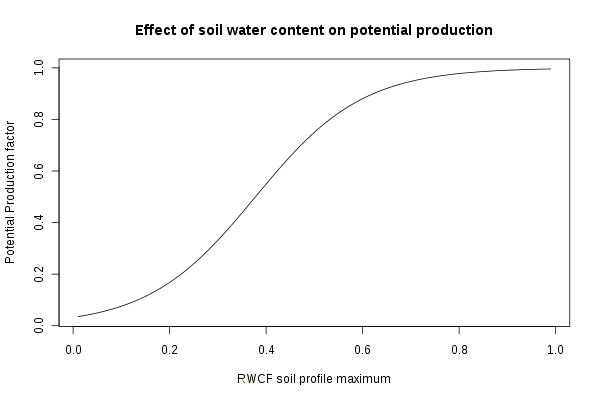
Soil Water Effect upon Production
The effect of available soil water upon potential production is modeled as a
logistic curve:
production factor = ( 1.0 + 30.0 * exp( -9.0 * rwcfMax ) )-1
where
rwcfMax
is the maximum relative water content fraction
(RWCF(*)
)
of the soil layers for the current month. The value of
production factor is
in the range 0-1.
The influence of soil water content is strong at low water content and weak at
high water content. In the mid-range, changes in soil water content will have
its strongest influence upon production. A typical curve for the factor-RWCF
relationship is:
Shading Effect upon Production
The shading effect on potential growth rate is a response surface dependent on
the amounts of live and dead vegetation.
A scaling factor for crops growing from seedlings
(PLTMRF, FULCAN)
reflects the partial interception of light with less than a full canopy present
(Figure 3-10).
This function, which was originally
developed for the tall grass prairie, was found to be too restrictive for no-till
cropping systems. Therefore, the magnitude of the effect has been greatly reduced
for crops by increasing the value of parameter
BIOK5.
Root Production
Root growth is proportional to potential shoot growth, but the allocation of
carbon to root growth can be made a function of time since planting
(FRTC(1...3))
(Figure 3-11)
to reflect the dominance of root growth in seedling cereal crops or the initial
dominance of shoot growth in root crops. To account for winter dormancy the root
- shoot ratio does not change in months when soil temperature is below 2 C
(RTDTMP).
Monthy Century:
In an alternative formulation (FRTC(1) = 0) developed for Great Plains grasslands,
the root-shoot ratio is controlled by annual precipitation
(Parton et al., 1987)
as shown in Figure 3-12.
Valid values of precipitation
for this algorithm, using the parameter values from
(Parton et al., 1987, eq. 7 and 8),
are >= 5.5 cm. The root:shoot ratio is calculated using fixed
parameters as
follows:
Root:Shoot = max. annual belowground production / max. annual aboveground production
           = (BGPPA + precipitation * BGPPB) / (AGPPA + precipitation * AGPPB)
Daily Century: The crop parameter
FRTCINDX
specifies the type of plant, annual
or perennial. If zero, use the Great Plains algorithm. FRTC(4) specifies the
fraction of variabilty of FRTC(1).
Typical root:shoot values for crop/grass systems are in the range 0.5 to 2.5.
This translates into (FRTC(1) in the range 0.33 to 0.71.
Nutrient Availability Effect upon Production
The actual production is limited to that achievable with the currently available
nutrient supply with plant nutrient concentrations constrained between upper
and lower limits set separately for shoots and roots. Invoking Liebig's Law
of the Minimum, the most limiting nutrient (ELIMIT) constrains production.
The limits of nutrient content for shoot growth are a function of plant biomass
in order to reflect the changing nutrient content with plant age
(figure 3-13).
The user specifies the effect of live shoot biomass on maximum and minimum
nutrient content (BIOMAX,
PRAMN(*,*),
PRAMX(*,*)).
For instance, for the aboveground biomass, the C:E range is calculated as:
C:E minimum, maximum =
PRAMN(E,0) + (range of PRAMN) * 2.5 * AGLIVC / BIOMAX
The biomass-to-C conversion factor is equal to 2.5 for above and below ground biomass.
This formulation does cause some anomalies when growth is limited by nutrients,
as a nutrient limited crop can have a higher nutrient concentration than an
unlimited crop of the same age with greater biomass. The limits on nutrient
content of roots are a function of annual precipitation
(PRBMN(*,*), PRBMX(*,*)).
CENTURY also incorporates a function to restrict nutrient availability in
relation to root biomass
(Figure 3-14).
For legume crops the potential rate of symbiotic nitrogen fixation is specified
in terms of grams N fixed per gram C fixed
(SNFXMX(1)).
It is assumed that plant available soil N will be preferentially used by the
crop. All other potential limitations to growth, including P and S supply, are
taken into account before calculating symbiotic N2 fixation.
This nitrogen is made available immediately to the plant for uptake.
Fertilizer addition is specifed as an amount (fertilization parameter
FERAMT)
per fertilization event.
Crop Harvest
At harvest, grain is removed from the system and live shoots can either be removed
or transferred to standing dead and surface residue.
Harvest may include roots, hay crops or straw removal after a grain crop
(see the harvest parameters).
The crop may be killed at harvest, as for cereal grain crops, or a fraction
of roots and shoots may be unaffected by harvest operations and growth may continue
(see HIBG and BGLREM).
For grain crops a harvest index is calculated based on a genetic maximum
(HIMAX)
and moisture stress
(HIWSF)
in the months corresponding to anthesis and grain fill
(HIMON(1,2))
as shown in
Figure 3-15.
Moisture stress is calculated as the ratio of actual to potential transpiration
in these months. The fractions of aboveground N, P, and S partitioned to the
grain are crop-specific constants
(EFRGRN(*))
modified by the square root of the moisture stress term, resulting in higher
grain nutrient concentrations when moisture stress reduces the harvest index.
At harvest a proportion of the aboveground nitrogen is lost to volatilization
(VLOSSP).
In the output files named *cropC.csv you will find the output variables
CGRAIN and
CGRACC.
These provide values for C in harvested grain per month and per year, respectively.
For N, P, S in harvested grains, see
EGRAIN and
EGRACC
in the *nps.csv output files.
Death of Shoots and Roots
The crop model allows for the death of shoots and roots during the growing season.
Shoot and root death are functions of available soil water in the whole profile
and the plant root zone respectively (
Figure 3-16
). Both are multiplied by crop specific maximum death rates (
FSDETH(1)
,
RDR
). Shoot death rates may be further increased (
FSDETH(3)
) due to shading if the live biomass is greater than a critical level (
FSDETH(4)
). Root death is only allowed to occur when roots are physiologically active,
defined by soil temperature being greater than 2 C (
RTDTMP
). In months nominated as senescence months the shoot death rate is set to a
fixed fraction of live biomass (
FSDETH(2)
). Standing dead material is transferred to surface litter at a crop specific
relative fall rate (
FALLRT
).
Plant lignin contents (
FLIGNI(*,*)
) are specified for shoots and roots, and may be constants or a linear function
of annual precipitation (
Parton et al., 1992
). They should reflect the lignin content of senescent plant material.
Fire Effect upon Production
The effects of fire and grazing on plant production are represented
in the model by using data from
Holland et al. (1992)
and
Ojima et al. (1990).
The major impact of fire is to increase the root to shoot ratio
(FRTSH,
fire parameters),
increase the C:N ratio of live shoots and roots (fire parameter
FNUE(*)),
remove vegetation and return nutrients during the years when fire occurs
(Ojima et al.,1990).
Grazing removes vegetation, returns nutrients to the soil, alters the root
to shoot ratio, and increases the N content of live shoots and roots
(Holland et al., 1992).
Leaf Area Index
Leaf area index is calculated from leaf biomass and a biomass-to-LAI conversion
factor. This factor is the average amount of biomass needed to have an LAI
equal to 1.0. Century uses 80.0 g biomass for this factor.