Soil Water Submodel
Leaching of C, N, P, and S Pools
Soil Temperature
Depending on the site parameter SWFLAG, the field capacity (AFIEL, site parameters) and wilting point (AWILT, site parameters) for the different soil layers can optionally be initialized from the site parameters or calculated during the simulation as a function of the bulk density (BULKD), soil texture (SAND, SILT, CLAY), and organic matter content (output variable SOMSC) using a choice of equations developed by Gupta and Larson (1979) or Rawls et al. (1982). Depending upon the value of SWFLAG, the wilting point and field capacity of each soil layer are recaculated after every change in soil texture and bulk density. Since these calculations are dependent upon soil organic matter content (SOMSC), recalculation will occur at least at the end of every simulation time step. If erosion or deposition events occur, then recalculation will be done after the erosion and deposition is modeled.
CENTURY uses a simplified water budget model which calculates monthly evaporation (EVAP) and transpiration (TRAN) water loss, water content of the soil layers (ASMOS(*)), snow water content (SNOW), runoff (RUNOFF), and saturated flow of water between soil layers (Figure 3-2). If the average air temperature (TAVE) is less than 0 C monthly precipitation (RAIN) occurs as snow. Sublimation and evaporation of water from the snow pack occurs at a rate equal to the potential evapotranspiration rate (PET). Snow melt occurs if the average (monthly model) or daily maximum (daily model) air temperature is greater than TMELT(1) (fixed parameter) and is a linear function of the average air temperature with slope = TMELT(2). (This is the temperature index method; see Singh and Singh, 2001).
Water applied to the surface of the site is the sum of precipitation and irrigation. This sum is partitioned into runoff, evaporation, transpiration, stream flow, base flow, and soil water storage.
Runoff calculation is controlled by the site parameters shown in the first table below. These parameters are used in a quadratic equation:
runoff = Aw2 + Bw - C
where w = total water (precipitation + irrigation), and
A, B, and C are coefficients described
in the table1. By setting the second order coefficient to zero, the runoff
equation becomes linear. If the equation result is negative, then the runoff is
set to zero. This check provides a threshhold value of applied water, below
which runoff does not occur (this is the X intercept of the equation). If the
site parameters are all zero, the default values are used.
| Site Parameter | Description | Default Value |
|---|---|---|
| RUNOFF(1) | second order coefficient A (non-linear term)
|
0 |
| RUNOFF(2) | first order coefficient B (linear term - slope)
|
0.55 |
| RUNOFF(3) | constant C (intercept) |
2.75 |
The default values for the coefficients are taken from
Probert et al. (1995) for plots
without surface residues. For plots with surface residues, coefficient B
is 0.41, and the constant C is 2.87. Century4-VEMAP used a
linear relationship: B = 0.15, C = 1.2. In the
Mississippi River basin in northwestern Mississippi,
Sharpe et al. (1998) and
Harden et al. (1999) used a
non-linear relationship derived from a fit to data: A = 0.0134,
B = 0.2509, C = 1.3318. These examples are listed in
the table 2.
| Source | A |
B |
C |
Threshhold (cm H2O) |
| Default values - no surface residue (Probert et al., 1995) | 0 | 0.55 | 2.75 | 5.0 |
| With surface residue (Probert et al., 1995) | 0 | 0.41 | 2.87 | 7.0 |
| Century4 - VEMAP | 0 | 0.15 | 1.2 | 8.0 |
| Mississippi (Sharpe et al., 1998) | 0.0134 | 0.2509 | 1.3318 | 4.3 |
A graph of these examples of the runoff calculation is shown in the following figure.
|
|
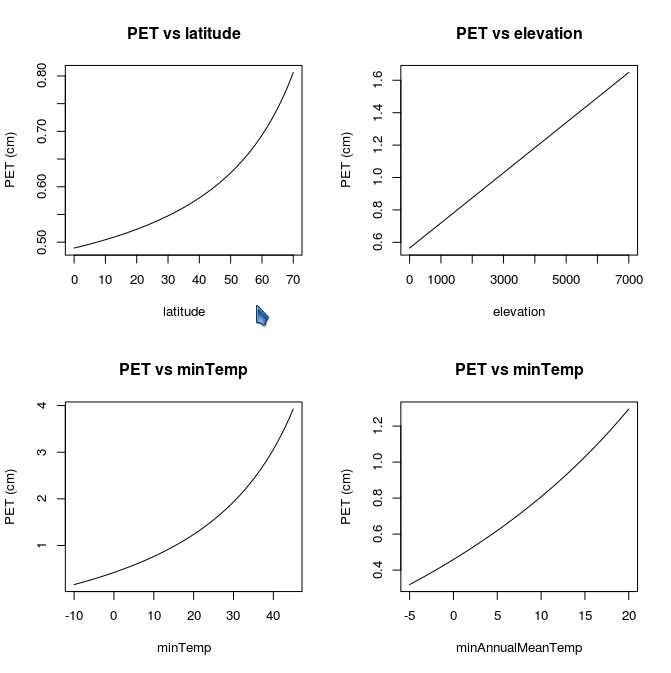
The potential evapotranspiration rate (PET) is calculated as a function of the average monthly maximum (TMX2M(*)) and minimum (TMN2M(*)) air temperature using the equations developed by Linacre (1977) and may be modified by a user specified multiplier (FWLOSS(4), fixed parameter). Bare soil water loss is a function of standing dead and litter biomass (lower for high biomass levels), rainfall and PET. Interception water loss is a function of aboveground biomass (increases with biomass level), rainfall and PET. Potential transpiration water loss (PTTR) is a function of the live leaf biomass and PET. Interception and bare soil water losses are calculated as fractions of the monthly precipitation and are subtracted from the total monthly precipitation, with the remainder of the water added to the soil. Water loss occurs first as interception, followed by bare soil evaporation and transpiration (the sum does not exceed the PET rate). The maximum monthly evapotranspiration water loss rate is equal to PET.
In calculation of PET, Century sets the minimum allowable monthly temperature to be -10.0 C, and the minimum allowable monthly PET to be 0.5 cm month-1. If a microcosm is being simulated, PET is fixed at 15.0 cm month-1. The following graph shows the effects of site variables on PET:
|
Infiltration uses a bucket model to distribute water through the soil layers. The water available after interception and bare soil evaporation is added to the top layer (ASMOS(1)) and then draining excess water (water above field capacity) to the next layer. Transpiration water loss (TRAN) occurs after the water was added to the soil.
Water leached below the last soil layer is not available for evapotranspiration and is a measure of interflow, runoff or leaching losses from the soil profile. Water going below the profile can be lost as storm flow (STORMF, site parameter specifying the fraction lost as fast stream flow) or leached into the subsoil where it can accumulate or move into the stream flow at a specified rate (BASEF, site parameter specifying the fraction per month (for Century5) or day (for DayCent5) of subsoil H2O going into stream flow). The model can simulate watershed stream flow by adjusting STORMF and BASEF. The output variable STREAM(1), total stream flow, is the sum of stream flow and base flow. Runoff is stored separately in RUNOFF and RUNOFFA.
The following list shows the sequence of calculations in the water submodel for monthly Century.
See DayCent5: Soil Water Submodel for a description of the DayCent5 soil water submodel.
A fraction of the products from the decomposition of the active pool is lost as leached organic matter (output variable STREAM(5)). Leaching of organic matter is a function of the decay rate for active SOM and the clay content of the soil (less loss for clay soils) and only occurs if there is drainage of water below the simulation layer depth (leaching loss increases with increasing water flow up to a critical level - see OMLECH , fixed parameters). The leaching function is
C Leached =
microbial_C
* [OMLECH(1) + OMLECH(2) * sand_fraction]
* [1.0 - (OMLECH(3) - water_leaching) / OMLECH(3)]
Leaching of labile mineral N (NO3 + NH4), P, and S pools occurs when there is saturated water flow between soil layers, that is, during infiltration. The fraction of the mineral pool that flows from the upper layer to the lower layer is a function of the sand content (increasing with increasing sand content - FLEACH(1) and FLEACH(2), fixed parameters) and the amount of water that flows between layers (linear function up to a maximum value - MINLCH, fixed parameters, cm per month). The fixed parameters FLEACH(3..5) control inorganic N, P, and S leaching respectively. Monthly soil losses of inorganic N, P, and S (STREAM(2..4)), and organic C, N, P, and S (STREAM(5..8)) are simulated by the model.
Average monthly soil temperature near the soil surface (STEMP) is calculated using equations developed by Parton (1984). These equations calculate maximum soil temperature as a function of the maximum air temperature and the canopy biomass (lower for high biomass) while the minimum soil temperature is a function of the minimum air temperature and canopy biomass (higher for higher biomass). The actual soil temperature used for decomposition and plant growth rate functions is the average of the minimum and maximum soil temperatures. Changes in soil temperature will lag behind the changes in air temperature if the difference in air temperature between months is greater than 2 C. This is a simple model of the temperature intertia in soils.
The submodel for daily temperature is described in the section Soil Temperature Submodel.