|
Addressing Management Questions for Ngorongoro
Conservation Area Using Savanna, an Integrated GIS-Simulation Modeling
System
Randall B. Boone1, Michael B. Coughenour1, James
E. Ellis1, and Kathleen A. Galvin1,2
1Natural Resource Ecology Laboratory and 2Department of
Anthropology
Colorado State University, Fort Collins, Colorado, USA
|
 Introduction
Ngorongoro Conservation Area (NCA), in northeastern Tanzania,
was created explicitly as a multiple-use area, with both wildlife conservation
and human welfare to be considered. The NCA is home to more than
50,000 Maasai pastoralists and their livestock, as well as world-renowned
wildlife populations and archeological sites. Large-scale changes
in NCA have occurred
in the last 25 years, with wildebeest numbers tripling to about 1.5
million at their peak,
agriculture outlawed, then reinstated, and increasing Maasai populations
becoming more
sedentary. Land managers require improved tools to assess management
options on NCA.
We used Savanna, a loosely linked GIS and ecological modeling
system to model the NCA ecosystem. We addressed six types of management
questions using the system.
Methods
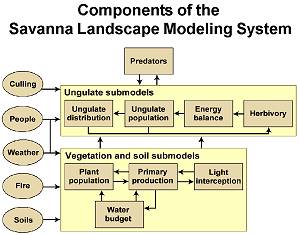
Development of the Savanna Modeling System began more than 15
years ago (Coughenour et al. 1985), and has now been applied at sites throughout
the world. Savanna is a series of interconnected FORTRAN subprograms
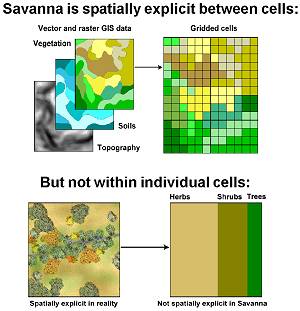
joined through a common set of GIS data layers. Savanna is spatially
explicit, using a girded system of cells to represent the landscape, with
each cell further divided horizontally into vegetation types and vertically
into layers of vegetation and soil.
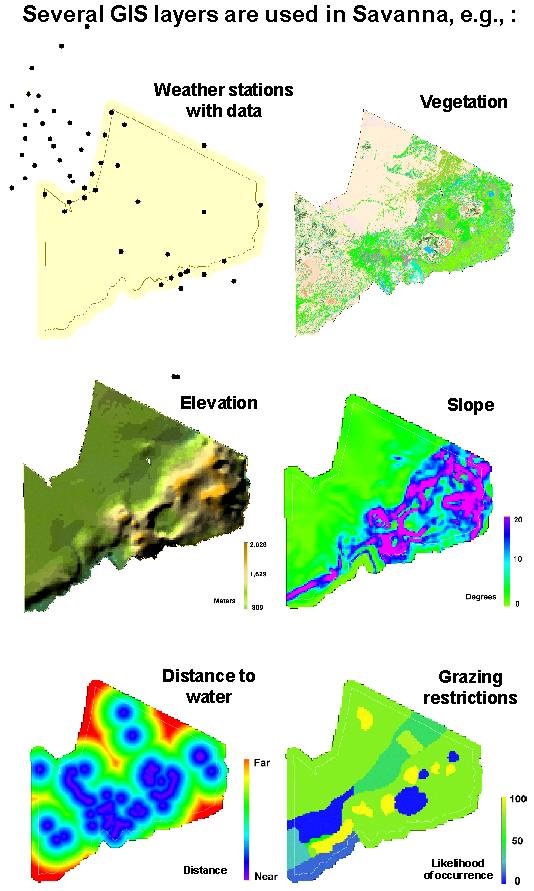
Several GIS layers are used as input into Savanna, and the model
outputs GIS layers as well. These GIS layers were generalized to
1 km x 1 km cells, and used in modeling. The model was parameterized
to describe responses of seven plant groups (e.g., grasses, forbs, evergreen
trees) and eight animal groups (e.g., cattle, wildebeest, goats and sheep,
giraffe). Model output was then assessed to the degree possible.
A model run was conducted based upon recent conditions for use
in comparisons, for the period 1973 to 1988. Then a series of six
types of management questions were addressed using Savanna. Three
of these types of questions were addressed simply by modifying the GIS
data used in Savanna, and we present a summary of these analyses here.
They included:
- Assessing the ecosystem effects of a two-year
long drought,
- Increasing access to grazing areas by livestock, and
- Adding water sources.
These analyses required modifying climate data, maps controlling access
to grazing, and distance to water maps, respectively. Example results
are shown. |


|
 |
| Results
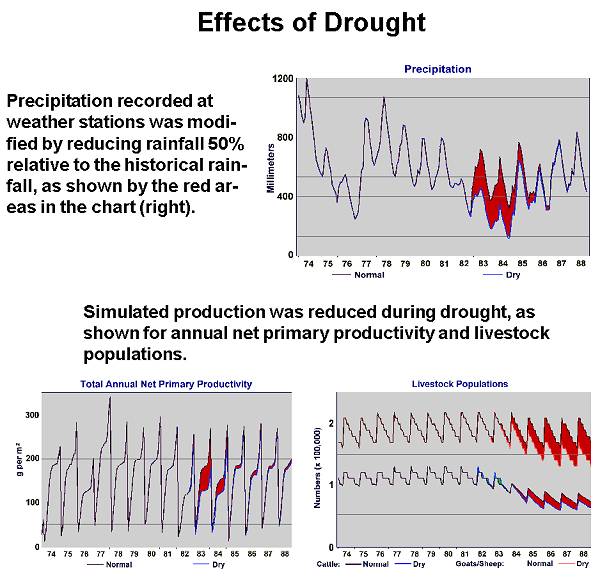
Effects of Drought
Drought was emulated by reducing rainfall by 50% in 1983 and
1984, relative to the control model. When modeled, annual net primary
productivity, herbaceous biomass, livestock populations, and wildlife populations
were reduced during the dry period. Reduced livestock populations
are shown recovering, in a density dependent response.
|
|
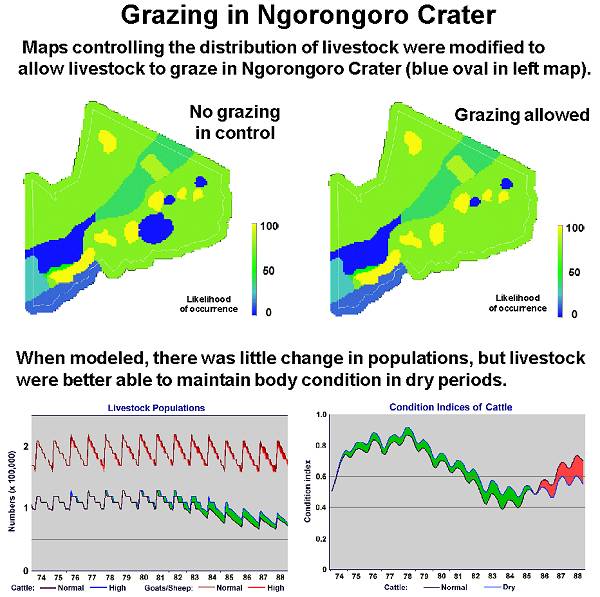
Grazing in Ngorongoro Crater
Maasai may not graze livestock in Ngorongoro Crater through legal
restrictions.
This constraint was incorporated into Savanna using a map limiting
distributions, and modified to allow grazing in Ngorongoro Crater.
Allowing livestock to graze in Ngorongoro Crater added a few
thousand cattle to the population. During dry years, cattle were
able to maintain body condition better than when excluded from the crater.
|
|
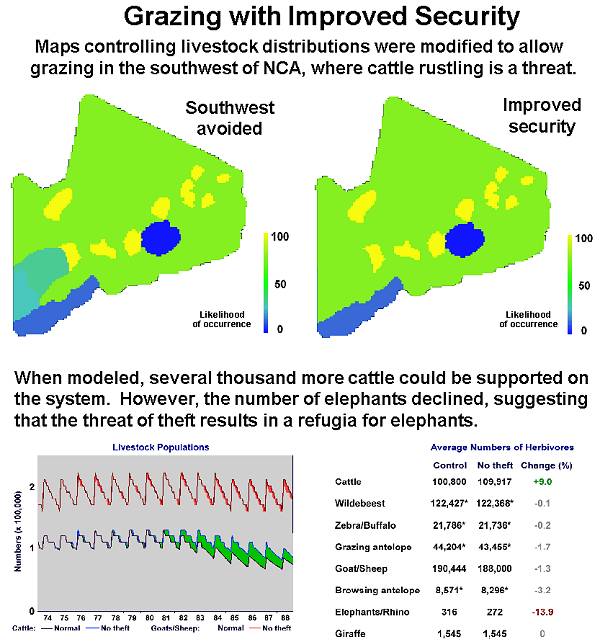
Grazing with Improved Security
Modifications were made to the maps described to allow livestock
to graze in the southwest, where they are currently excluded because of
the likelihood of theft. Several thousand more cattle could be supported
if security in the south was improved. However, the number of elephants
dropped by more than 13%. |
|
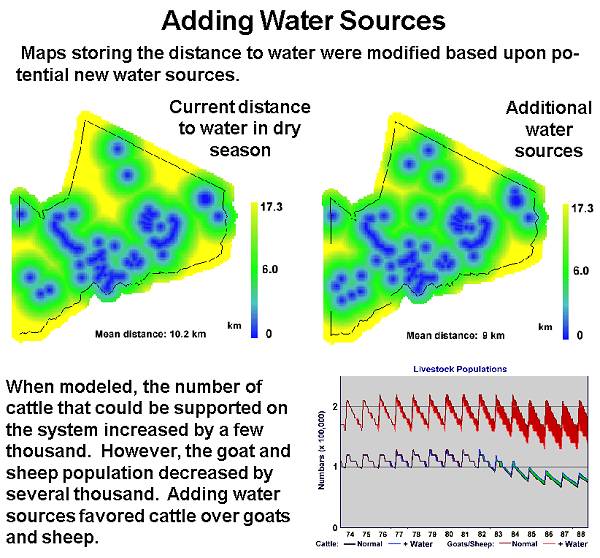
Adding Water Sources
Distance to water maps were modified to incorporate new permanent
water sources. More cattle could be supported in the system with
improved water supply, but these additional cattle competed for forage
with goats and sheep, reducing their populations.
|
|
Discussion
In a series of meetings held in July 1999, these results (and
others) were presented to almost 100 East Africans involved in natural
resource management, including managers from Ngorongoro Conservation Area.
Feedback was favorable, and managers look forward to having the tool
available. Favorable comments notwithstanding, the results presented
were understood to be exemplary. Assessments and comments we received
spawned the following improvements: 1) increase plant biomass estimates to match
recorded data, 2) further divide animal groups to improve realism, and
3) include density dependent effects from disease when modeling animal
populations, rather than model at carrying capacity. These modifications are ongoing.
|
| References:
Human population numbers from 1954 to 1999 were from:
Ngorongoro Conservation Area Authority. 1999. 1998
Aerial boma count, 1999 people and livestock census,
and human population trend between 1954 and 1999 in the NCA.
Research and Planning Unit, Ngorongoro Crater, Tanzania.
Unpublished report.
Coughenour, M.B., J.E. Ellis, D.M. Swift, D.L. Coppock, K. Galvin, J.T.
McCabe, and T.C. Hart. 1985. Energy extraction and use in a
nomadic pastoral population. Science 230:619-625. |
|