Climate Change
The phrase 'climate change' can invoke strong emotions in some people today, whether they are adamantly denying its existence or bemoaning the idea that the world is doomed, or points of view in between. But what exactly is climate change, and what facts are accurate in the face of these differing opinions?
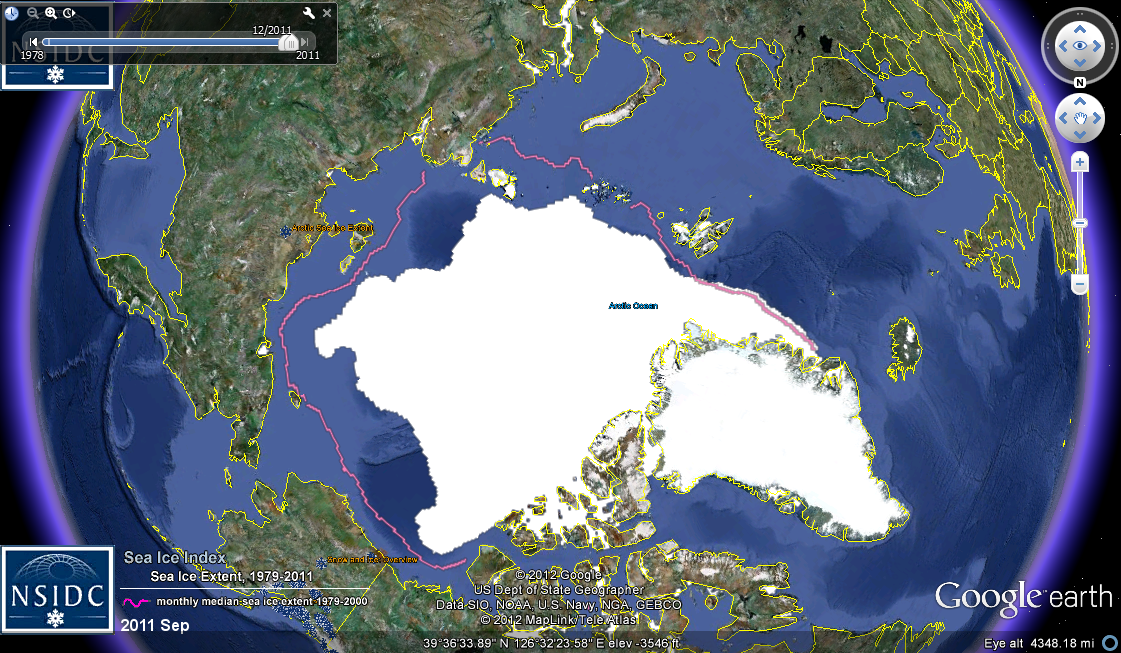
According to the Climate Impacts Group at the University of Washington, average yearly temperatures have risen by 1.5 degrees Fahrenheit (0.83 Celsius) in the 20th century and are expected to rise 0.5 degrees Fahrenheit per decade in the 21st century. While this may not seem like a huge change, these rising temperatures have caused the loss of glaciers and the thinning of ice caps, the rise of the sea level, more frequent heavy precipitation in some parts of the world, and more intense droughts in others.
Thousands of scientists have reviewed the evidence as part of an Intergovernmental Panel on Climate Change, and agree; while some climate change is natural, the temperature increase we have seen in the last century is mainly due to human influence. One of the reasons that temperatures have been increasing is because of more carbon dioxide occurring in our atmosphere. Carbon dioxide and other gases reflect heat radiating into the atmosphere back toward earth, rather than allowing it to radiate into space as it normally would. The main emission of carbon dioxide comes from people burning fossil fuels to heat our homes and generate electricity. Scientists have taken samples of ice cores from deep ice sheets in Antarctica, and have determined levels of carbon dioxide were in the atmosphere thousands of years ago. Based on these tests, our current levels of carbon dioxide are higher than they have been for the past 650,000 years.
Earth system changes related to increases in carbon dioxide are reflected in images of landscapes, the kinds of images captured by NASA satellites. With support from NASA, our project works to educate teachers and students about climate change using NASA satellite images.


NASA Global Climate Change Education Project