
Overview
As our climate warms, the distribution of plants and animals are shifting toward the poles or to higher elevations. Many teams of researchers preduct the future ranges of species given their current distributions and projections of climate change. They use a method called niche envelop modeling. The observed distributions of a species and a suite of environmental data are used to define the areas the species occupies. Often climate data play a part in the distribution of a species. The researchers will replace the climate data in the model with predicted future climate data and re-predict the distribution of the species. They use the result from that to represent how a species' distribution may change in response to global warming.
Three main assumptions included in niche envelop modeling are of interest here: 1) species cannot interact, so if one species outcompetes another it will not show using those methods; 2) species can't change the kinds of habitats they use, even though people see this happening; and 3) the methods assume individuals can move unlimited distances. We developed a modeling approach that addresses this limitations.
Approach
To represent the occurrence of many species, we use the North American Breeding Bird Survey (BBS). We owe thanks to the organizers of the BBS, and to the many volunteers. Each year, trained birders travel the same 25 mile routes, stopping every half mile to record all the birds heard or seen in three minutes. Thousands of routes are surveyed each year. We are using the data from the last five years to represent current bird distributions.
A large graphic summarizes our methods. Click on the graphic to enlarge it in a new tab, which uses information from Matthews and others (2004).
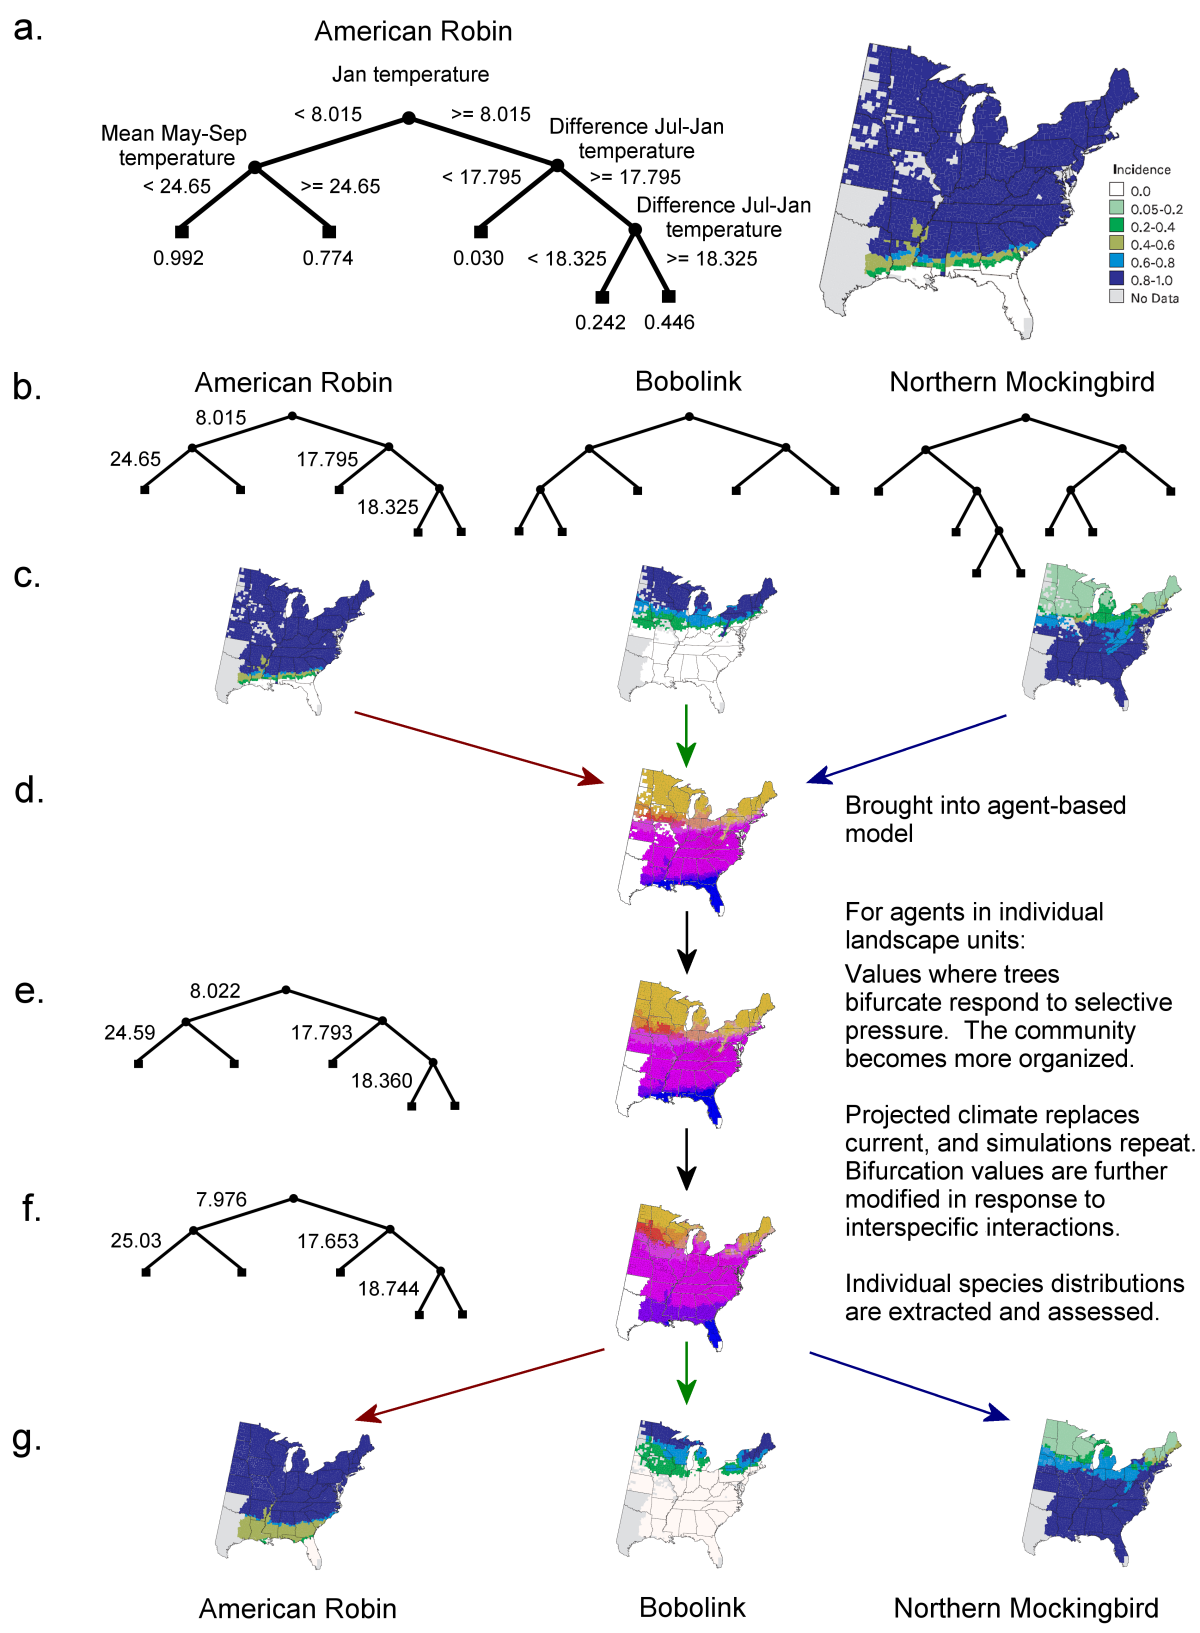
a. Sunil Kumar and Jared Stabach are using a method called decision tree analysis to predict the distribution of as many species as possible in the BBS. The result of such an analysis is a tree that shows how often the type of bird uses different areas. The values at the "leaves" of a tree give the relative density. In the example, American Robins are most numerous in areas with January temperatures below 8 degrees C. The tree continues to divide areas into smaller subsets.
b. There won't be sufficent data in the BBS to create trees for all the species, but we expect to have 100 or 150 species with good trees.
c. Each of the decision trees will yield a map of relative abundance for a species.
d. In an agent-based model written in NetLogo, we will read in all the trees and be able to represent the number of species in areas across the United States.
e. An evolutionary process will be represented in the agent-based model. Data that predicts what future climate will be like will be brought into the model. Then the birds of a given species within an area will compete with other kinds of birds to occupy new areas. The cut-offs seen in decision trees will mutate by tiny amounts, and birds that are successful at colonizing new areas will spread. Those that do not may disappear from an area.
f. Eventually changes in species distributions will slow or stop, and we will call the result the final model with mutated decision trees representing new distributions of species.
g. We will then be able to create maps showing the ranges that species may have under climate change. Some will not really change, and some will change quite a lot.


NSF Macro grant 1241583